BACKGROUND
Water supplies for irrigation are declining in many irrigated regions due to lower pumping capacities, smaller surface water
supplies, and regulated restrictions of water applications. To reduce irrigation, irrigators can consider choosing crops with smaller
irrigation requirements, growing crops in rotation within the same fields, or irrigating fewer acres. Irrigators with shrinking water
supplies who are evaluating these choices need to know the potential net economic returns from each combination of crops and
water applications to each crop that suit their management systems.
The Crop Water Allocator (CWA) has been developed for irrigators to allocate limited water among selected crops. CWA
calculates net economic returns from all possible combinations of crops, irrigation allocations among crops and ranks the net
returns from maximum to minimum values. By changing rainfall, production costs, commodity prices, irrigation costs, irrigation
efficiency, and maximum yields, CWA users can find changes in net returns in response to these input variables.
Net economic returns do not include fixed costs associated with land and equipment investments. Net return is calculated with
this formula:
(Crop Yield X Crop Price) – (Production Costs) – (Irrigation Costs).
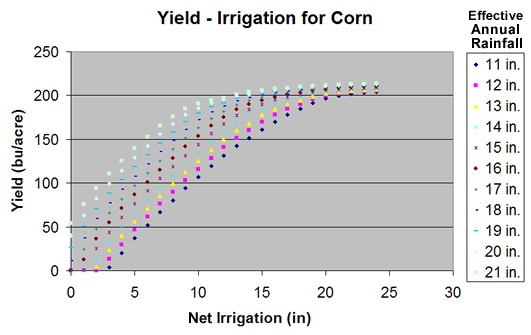
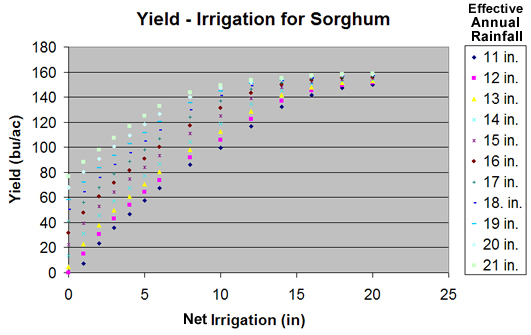
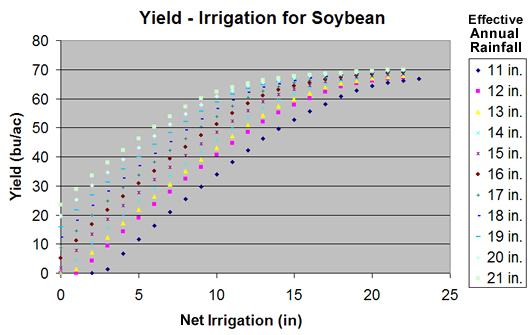
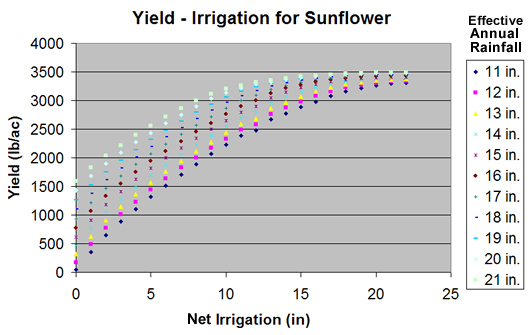
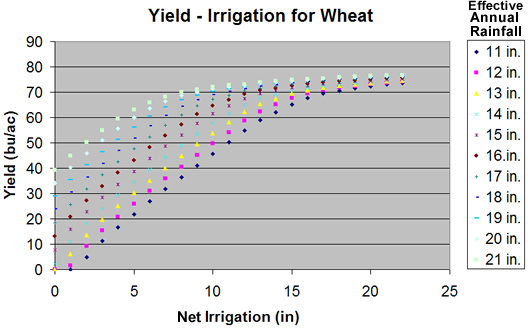
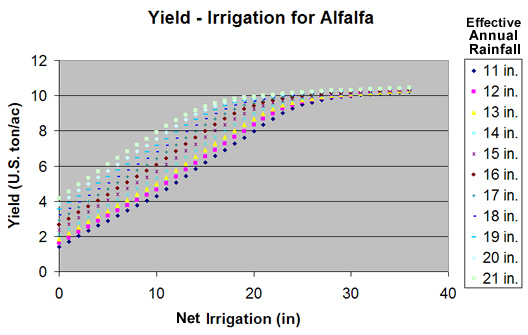
Crop yields are determined from applied irrigation. Yield-irrigation relationships have been developed from field research to
quantify crop yields from irrigation over a range of water application from dryland to full irrigation. These data along with weather
parameters from 30 years were used as inputs to a crop simulation model. The model was executed for applied irrigation and
annual precipitation (0 to 24 inches). The following graphs are yield-irrigation results for each crop grown in silt loam soils.
Crop production costs can come from the CWA user’s own information or from default production costs that were developed by in the
Kansas State University Farm Management Guide crop budgets available on www.agmanager.info . Irrigation costs are calculated
from pump discharge rate (gpm) pumping lift (ft), operating pressure (psi), fuel cost, labor for irrigation, and repairs and maintenance.
The user of CWA can choose one of five possible ways to divide the field which are called “land splits” (100%; 50%-50%; 75%-
25%; 33%-33%-33%; 50%-25%-25%; or 25%-25%-25%-25%). The user can choose one land split for each execution of CWA or
hold “land split” constant as other inputs are changed. The program will assign every combination of every selected crop to each
part of the land split. More crops than land splits can be selected for CWA analysis. One crop may be in more than one part of the
rotation. Irrigation is then allocated to each crop in each combination of selected crops for the rotation.
Net return results from all combinations of crops in each part of the rotation and irrigation level are “stacked” from maximum to
minimum. The user can scroll through approximately 20 of the largest net return results displayed on the output screen. Some of the
crop combinations in the rotation may not be feasible for the user even though they have more net return than others. For example,
soybeans in all parts of the rotation would not be feasible because continuous soybeans are not recommended.
CWA assumes that farming practices are carried out with good crop management in dryland, limited irrigation, and full irrigation
situations. The yield relationships with irrigation that are the foundation for the model are based on research and management
practices in “best management” crop production. Crop management that does not meet “best management practices” will not achieve
the predicted results of CWA.
FIELD AND IRRRIGATION INPUT TAB--- Field and Location Information
Acres: Land area may be a field, a farm, a watershed, or a river basin. The program calculates results on a per acre basis so the
program is not dependent on land size. The total amount of water supplied to the designated area would need to be included for the
irrigation cost calculations.
Soil Type: One of three soil types can be selected: (1) silt loam with the capacity to store 2.4 inches of available water per foot of
soil; (2) loamy sand with the capacity to store 1.3 inches of available water per foot of soil; or (3) fine sand with the capacity to store
0.9 inches of available water per foot of soil. Available water is the soil’s ability to hold water between “field capacity” and “wilting
point”. At field capacity the water that drains easily through the soil (in 1-2 days) cannot be retained. The remaining water is held
and available for crop uptake. At wilting point the soil is so dry that the plant can no longer extract water and it dies. The water held
in the soil between field capacity and wilting point is its available soil water storage capacity.
Annual Rainfall: The total amount of precipitation that can be expected during the calendar year. Annual rainfall can be from 11 to
24 inches. Changing the value for precipitation from one execution of the program to the next, leaving all other inputs the same, will
give the influence of precipitation on net economic return.
Applied Irrigation: The amount of groundwater applied on the field or surface water diverted to the field is units of inches (the depth
of water over the area irrigated). “Applied irrigation” is the same as “gross irrigation”. The annual applied irrigation is in units of
inches.
Land Split: Irrigated or non-irrigated acreage can be divided five ways: 100%; 50%-50%; 75%-25%; 33%-33%-33%; 50%-25%-25%;
and 25%-25%-25%-25%. The user can choose one land split for each execution of CWA or hold “land split” constant as other inputs
are changed. The program will assign every combination of every selected crop to each part of the land split.
FIELD AND IRRIGATION TAB – Irrigation Information
Discharge Rate: The flow of water from the pump (gallons per minute) to the irrigated area. The discharge rates of all pumps that
supply water to the field or fields need to be summed for the analysis.
Season Pumping: The hours that the pump operates during the year. The program calculates the applied irrigation that the pump
could deliver from the discharge rate, hours of pumping, and acreage. If more than one pump delivers water to the irrigated area,
enter the average hours pumped by the wells. This is the upper limit of water applied by that system.
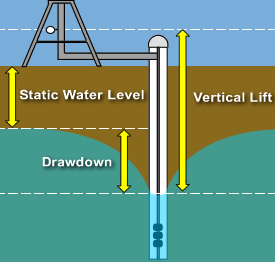 Pumping Lift: Static water level in the well plus draw down of the aquifer during pumping in feet. This is the distance the pump needs to lift water to the surface.
Well-head Pressure: The water pressure (in psi) at the top of the well is part of the calculation of irrigation costs.
Irrigation System Efficiency: Net irrigation (water delivered to the ground surface and available for evapotranspiration) divided by
applied water. Suggested efficiencies:
|
Irrigation System |
Efficiency |
|
Average surface irrigation |
50% |
|
Surface with surge valve |
60% |
|
Surface with tail water recovery |
70% |
|
Surface with surge valve and tail water recovery |
80% |
|
Sprinkler with heads on top of mainline |
85% |
|
Sprinkler with heads at top of canopy |
88% |
|
Sprinkler with heads in canopy |
90% |
|
Drop Irrigation |
95% |
Fuel types: Possible fuel types and units of costs are:
|
Diesel |
$/gallon |
|
Propane |
$/gallon |
|
Natural Gas |
$/mcf (thousand cubic feet) |
|
Electricity |
$/kWh (kilowatt-hour) |
Fuel Cost: The user enters the cost based on the units of measurement.
Labor: The labor cost associated with operating the irrigation system based on how many hours the pump operates.
Repairs and Maintenance: Materials cost for repairing and maintaining the system in terms of $ per acre-inch of applied irrigation.
Irrigation Cost Subtotal: This value does not include labor in this calculation. Labor costs are added to the irrigation costs when the
program determines the hours that the pump needs to operate to apply the water needed.
Repairs and Maintenance: Materials cost for repairing and maintaining the system in terms of $ per acre-inch of applied irrigation.
Irrigation Cost Subtotal: This value does not include labor in this calculation. Labor costs are added to the irrigation costs when the program determines the hours that the pump needs to operate to apply the water needed.
CROPS, PRICES, YIELDS TAB
Crops: The crops available for analysis are listed with a “check box” to the left of the crop name. By clicking the “check box”, the
crop will be used in the analysis. Fallow is one of the “crops” because one alternative is to fallow part of the field during the growing
season so more water can be applied to the rest of the field. CWA will use each combination of crop checked in each part of the field
for the chosen land split. CWA will compare combinations of more crops than the number of land splits in one program execution.
Price per unit: Commodity prices are very important for determining the optimal crop mix in CWA. They need to be realistic over
the expected life of the rotation if the user intends to predict reasonable net returns. Results from CWA can be sensitive to price
relationships among commodities. For FSA program crops, the loan rate should be the minimum price entered.
Maximum Yield: Maximum yield is the field’s capability to produce with no restriction on water without yield limitations from other
effects of weeds, insects, diseases or lack of fertilizer. The maximum yield modifies CWA’s yield predictions default yield-irrigation
functions. The values of yield from a given amount of applied water shift up or down depending on whether the user’s maximum yield
is greater or less than the default yields.
Crop Input Costs: When a crop is selected for analysis, it appears as a tab along with the “Field and Irrigation” and “Crops, Prices,
Yields” tabs. By clicking onto the crop tab, a drop-down table appears for input costs associated with that crop. The default costs
are from the KSU Farm Management Guide crop budgets available on www.agmanager.com . The user can change any costs
manually. Note: Fixed costs for irrigation equipment and land are irrelevant to determining the optimal crop mix because they will be
the same regardless of which crop or crops are grown. Therefore, the model will calculate net incomes that can be expressed as a
return to land, management, and irrigation equipment.
General Input Costs: General production costs are crop-specific. Nitrogen, phosphorus, and seeding costs can be based on
the optimal rate to achieve the calculated yield for the crop by checking the “optimal” box. CWA users can uncheck the optimal
boxes and enter nitrogen, phosphorus, or seeding rates manually. Herbicide and insecticide costs are the total cost per acre for all
treatments used for the crop from the harvest of the previous crop through the current growing season.
Optimal Seed Rates
| Optimal Seeding Rates used in Crop Water Allocator: |
| Alfalfa |
| Net Irrigation |
Seeding Rate |
| 0 through 36 in. |
3 lbs. / acre |
|
| Corn |
| Net Irrigation |
Seeding Rate |
| 18 in. and over |
32,000 seeds / acre |
| 15 - 17 in. |
29,000 seeds / acre |
| 12 - 14 in. |
26,000 seeds / acre |
| 9 - 11 in. |
23,000 seeds / acre |
| 6 - 8 in. |
20,000 seeds / acre |
| 0 - 5 in. |
17,000 seeds / acre |
|
| Grain Sorghum |
| Net Irrigation |
Seeding Rate |
| 18 in. and over |
7.81 lbs. / acre |
| 15 - 17 in. |
6.56 lbs. / acre |
| 12 - 14 in. |
5.31 lbs. / acre |
| 9 - 11 in. |
4.06 lbs. / acre |
| 6 - 8 in. |
2.81 lbs. / acre |
| 0 - 5 in. |
1.56 lbs. / acre |
|
| Soybeans |
| Net Irrigation |
Seeding Rate |
| 18 in. and over |
200,000 seeds / acre |
| 15 - 17 in. |
185,000 seeds / acre |
| 12 - 14 in. |
170,000 seeds / acre |
| 9 - 11 in. |
155,000 seeds / acre |
| 6 - 8 in. |
140,000 seeds / acre |
| 0 - 5 in. |
125,000 seeds / acre |
|
| Sunflower |
| Net Irrigation |
Seeding Rate |
| 18 in. and over |
25,500 seeds / acre |
| 15 - 17 in. |
24,000 seeds / acre |
| 12 - 14 in. |
22,500 seeds / acre |
| 9 - 11 in. |
21,000 seeds / acre |
| 6 - 8 in. |
19,500 seeds / acre |
| 0 - 5 in. |
18,000 seeds / acre |
|
| Wheat |
| Net Irrigation |
Seeding Rate |
| 0 through 18 in. |
90 lbs. / acre |
|
Operation Costs: Total tillage, planting, herbicide, and insecticide application costs can be entered in this section. For each item,
the number of operations should be multiplied by the cost per acre and entered into the appropriate box. Default operation costs are
based on custom rates from www.agmanager.com .
Harvest Costs: Harvest costs can be determined from a flat rate or itemized costs.
Additional Returns and Costs: Users can enter income from non-cash crop enterprises such as grazing wheat pasture, utilizing
crop residues, or government payments into “Misc. Returns”. Crop insurance premiums can be included in “Misc Costs”. Note:
because government payments (direct and counter-cyclical) will be the same regardless of the crop planted, this information is
irrelevant in terms of determining the optimal crop mix, but this information can be entered for cash flow purposes.
CALCULATING RESULTS
Clicking the “Calculate” button after all inputs are entered produces the results in the output table.
Rank: The results are in rows delineated by the highest to lowest net return.
Acres: The land area devoted to each crop.
Crop: The crop combination for in each section of the field. The same crop may be in more than one section of the field.
Yield: The crop yield derived from the applied irrigation for that crop.
Applied Irrigation: The depth of water applied on that crop-section of the field. The total volume of applied irrigation (irrigation depth
X acres) is distributed among the crops for the best net return. Lower ranking options may have different allocations of water among
the same crop combination, but the same volume of water designated in the inputs will be distributed in every option.
Operating Costs and Returns: The total of crop production costs and irrigation costs for each crop in the ranked option. Returns
are the net returns (yield X price – operating costs) for each crop in the ranked option.
Total Net Return: The total net return is the whole field net return resulting from averaging the returns for each crop.
PINNING OPTIONS FOR NEXT EXECUTION
The “pins” to the right of the “Total Net Return” column can be activated by clicking the pin icon for the option that will be retained
for the next execution of CWA. The pinned options will appear at the top of the ranking and the new execution’s ranked options will
follow. The pinned options will not be “re-ranked” with the options from the next execution. The pins can be removed by clicking on
the pin icon.
ADJUSTING SIZE OF INPUT AND OUTPUT TABLES
Clicking on the small bar between the input and output tables and dragging it sideways allows the user to shrink or expand one or the
other of the tables.